Des Moines Basement Water Statistics 2026
Published November 2, 2026 · Sources checked November 2, 2026
Written by Arthur Smelyansky, Publisher, Lower Level Guide · Last updated: November 2, 2026
Des Moines offers a documented path to possible reimbursement for certain private-property water-protection measures, but eligibility and available funding are conditions, not promises. This reference places that program beside city housing estimates, airport climate normals and a residential alteration-permit count. Its ten findings help homeowners and writers separate what is measured from what must be established for a project. Neither the climate data nor the permit total counts waterproofing jobs, and a listed program measure is not a diagnosis of a wet basement.
Every finding links to its original publisher. The year in the title is the review year; the data periods remain beside the numbers. For property-level questions, start with our local basement waterproofing guide.
Key Takeaways
- 90,105 households. U.S. Census Bureau (2020-2024 ACS).
- 60.5% owner-occupied. U.S. Census Bureau (2020-2024 ACS).
- 36.55 inches annual precipitation. NOAA NCEI (1991-2020 climate normals).
- June: 5.26 inches. NOAA NCEI (1991-2020 climate normals).
- Up to $1,500 for qualifying work. City of Des Moines (Ordinance 16,442, 2025; application revised 2025).
- 2,193 residential addition/alteration permits in FY2024-25. City of Des Moines (FY2024-25, reported September 2025).
Contents
- How large is the resident household base?
- Who owns the occupied housing?
- What is the housing value context?
- What is the long-run rainfall baseline?
- When is the wettest average month?
- How concentrated is the wetter season?
- How often does heavier daily rain occur?
- What is the winter exposure?
- What assistance does the city document describe?
- How much residential alteration activity is recorded?
- Methodology and limits
- Frequently asked questions
- Sources
How large is the resident household base?
90,105 households is the Census estimate for Des Moines city, Iowa, based on the 2020-2024 ACS. It describes occupied households across the city rather than a count of detached houses, foundations or basements. U.S. Census Bureau.
The estimate covers households within the city boundary. It does not count basements or properties eligible for the city's subsidy. Eligibility depends on the program's conditions, while this is a broader housing measure.
| Measure | Value / scope |
|---|---|
| Finding | 90,105 households |
| Geography | Des Moines city, Iowa |
| Data period / document | 2020-2024 ACS |
| Measure type | ACS five-year estimate |
Table 1: ACS five-year estimate. U.S. Census Bureau; 2020-2024 ACS. City boundary only; includes renters and non-basement homes. Not a repair-demand count.
Who owns the occupied housing?
60.5% of occupied housing units were owner-occupied in Des Moines city, Iowa in the 2020-2024 ACS. The denominator is occupied housing units; it is not all residents or all buildings. U.S. Census Bureau.
The owner-occupancy rate is background context for local housing tenure. It is not the fraction of homes that have water problems or qualify for assistance. Do not multiply it by a permit total to estimate a customer pool.
| Measure | Value / scope |
|---|---|
| Finding | 60.5% owner-occupied |
| Geography | Des Moines city, Iowa |
| Data period / document | 2020-2024 ACS |
| Measure type | ACS five-year estimate |
Table 2: ACS five-year estimate. U.S. Census Bureau; 2020-2024 ACS. Ownership share does not measure foundation or basement problems.
What is the housing value context?
$194,700 was the median value of owner-occupied housing units in Des Moines city, Iowa in the 2020-2024 ACS. This is a housing-value estimate, not a sale-price series or an estimate of repair cost. U.S. Census Bureau.
The median value describes owner-occupied housing units. It does not establish a waterproofing price or a household's available repair budget. Compare proposed work by its diagnosis, scope and terms rather than by this citywide value alone.
| Measure | Value / scope |
|---|---|
| Finding | $194,700 median owner-occupied home value |
| Geography | Des Moines city, Iowa |
| Data period / document | 2020-2024 ACS |
| Measure type | ACS five-year estimate |
Table 3: ACS five-year estimate. U.S. Census Bureau; 2020-2024 ACS. Home value is not repair cost or ability to pay.
What is the long-run rainfall baseline?
36.55 inches is the annual precipitation normal for DES MOINES INTL AP, IA US, station USW00014933, for 1991-2020. Precipitation is a water-equivalent measure, including frozen precipitation; this figure is not an observation for 2026. NOAA NCEI.
The station normal describes the historical climate baseline. It does not measure this year's rain, a property's groundwater level or the performance of its drainage. Use the station and period whenever quoting the figure.
| Measure | Value / scope |
|---|---|
| Finding | 36.55 inches annual precipitation |
| Geography | DES MOINES INTL AP, IA US; USW00014933 |
| Data period / document | 1991-2020 climate normals |
| Measure type | Climate normal |
Table 4: Climate normal. NOAA NCEI; 1991-2020 climate normals. Airport station baseline, not a 2026 observation.
When is the wettest average month?
June, at 5.26 inches, has the highest monthly precipitation normal in the 1991-2020 series for DES MOINES INTL AP, IA US. The comparison uses all twelve monthly values from the same station and period. NOAA NCEI.
June has the highest monthly normal in the Des Moines station series. This is a comparison of long-run monthly averages, not a forecast or a basis for choosing a pump. The underlying values appear in the table below.
| Measure | Value / scope |
|---|---|
| January | 1.08 inches |
| February | 1.34 inches |
| March | 2.17 inches |
| April | 4.02 inches |
| May | 5.24 inches |
| June | 5.26 inches |
| July | 3.82 inches |
| August | 4.17 inches |
| September | 3.18 inches |
| October | 2.78 inches |
| November | 1.91 inches |
| December | 1.58 inches |
Table 5: Monthly normal comparison. NOAA NCEI; 1991-2020 climate normals. Average monthly total is not design storm intensity.
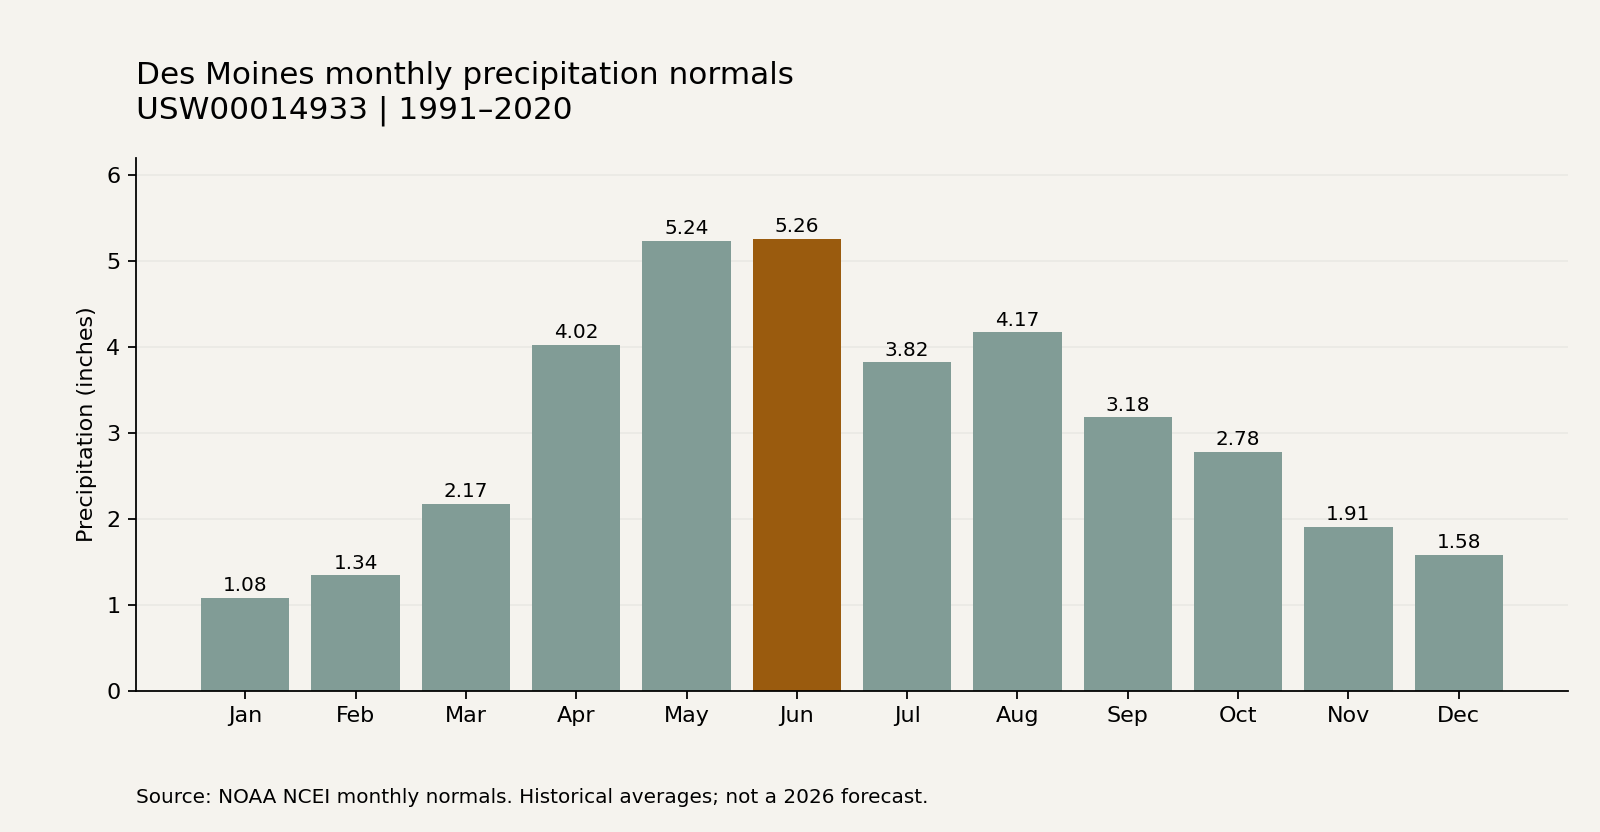
Chart: Lower Level Guide, using the linked NOAA monthly series for 1991-2020. Exact values appear in the table.
How concentrated is the wetter season?
24.68 inches is the sum of the March-August precipitation normals for DES MOINES INTL AP, IA US, using 1991-2020 data. This is our calculation from six published monthly values, not a separate NOAA seasonal statistic. NOAA NCEI.
This calculation sums March through August from a single normal period. It is useful for explaining seasonality, while an individual basement investigation still needs observations of entry routes and the installed systems.
| Measure | Value / scope |
|---|---|
| March | 2.17 inches |
| April | 4.02 inches |
| May | 5.24 inches |
| June | 5.26 inches |
| July | 3.82 inches |
| August | 4.17 inches |
| March-August sum | 24.68 inches |
Table 6: Derived seasonal sum. NOAA NCEI; 1991-2020 climate normals. Sum of six monthly normals; no damage inference.
Calculation: 2.17 + 4.02 + 5.24 + 5.26 + 3.82 + 4.17 = 24.68 inches. Each input is a published monthly normal; no annual share or damage estimate is inferred.
How often does heavier daily rain occur?
8.8 days per year is the station normal for days with at least 1.00 inch of precipitation at DES MOINES INTL AP, IA US, during 1991-2020. It is an average frequency, not a return period or a count of storms expected in a future year. NOAA NCEI.
The historical average counts days meeting the stated rainfall threshold. It is not a count of sewer backups, flood claims or eligible subsidy applications. Those outcomes require their own records and definitions.
| Measure | Value / scope |
|---|---|
| Finding | 8.8 days/year with at least 1 inch |
| Geography | DES MOINES INTL AP, IA US; USW00014933 |
| Data period / document | 1991-2020 climate normals |
| Measure type | Climate-normal frequency |
Table 7: Climate-normal frequency. NOAA NCEI; 1991-2020 climate normals. A historical average frequency, not a forecast or return period.
What is the winter exposure?
127.9 days per year is the normal for days with a minimum air temperature at or below 32°F at DES MOINES INTL AP, IA US, for 1991-2020. The measure counts cold days, not ground freeze-thaw cycles. NOAA NCEI.
The minimum-temperature frequency supplies winter context. It does not describe basement temperature, frozen discharge lines or cycles of ground movement. A maintenance recommendation should be tied to the actual equipment and installation.
| Measure | Value / scope |
|---|---|
| Finding | 127.9 days/year with minimum temperature at or below 32°F |
| Geography | DES MOINES INTL AP, IA US; USW00014933 |
| Data period / document | 1991-2020 climate normals |
| Measure type | Climate-normal frequency |
Table 8: Climate-normal frequency. NOAA NCEI; 1991-2020 climate normals. Cold days are not a count of ground freeze-thaw cycles.
What assistance does the city document describe?
Up to $1,500 is the maximum subsidy described in Des Moines Ordinance 16,442 (2025) for qualifying private-property protection work. Preapproval, available funds and other conditions apply. The amount is a conditional program maximum, not a typical waterproofing cost or a promise of reimbursement. City of Des Moines.
The program documents distinguish qualifying work, preapproval and reimbursement. They do not confirm current funds or eligibility for a particular address. Resolve the property's water problem and proposed scope separately from the funding application.
| Measure | Value / scope |
|---|---|
| Maximum subsidy | $1,500 for qualifying work |
| Application deadline in the cited ordinance | June 1, 2028, before work starts |
| Completion deadline in the cited ordinance | June 30, 2028 |
| Documentation deadline in the cited ordinance | August 31, 2028 |
| Funding and approval | Subject to available funds and city preapproval |
Table 9: Conditional program maximum. City of Des Moines; Ordinance 16,442, 2025; application revised 2025. Pre-approval and available funds required; no promise of funding or replacement-pump eligibility.
Ordinance 16,442, adopted March 10, 2025, limits eligible backwater-valve work to a new installation protecting the entire basement or lowest level and excludes work required by the city. It sets June 1, 2028 as the application deadline and June 30, 2028 as the work-completion deadline; preapproval and available funding still apply. Read the ordinance.
The city application, revised October 30, 2025, excludes replacement of an existing sump pump. It describes qualifying new installations or redirections, roof-leader disconnection and new backwater valves. Work must follow its permit and licensed-plumber conditions. Confirm current eligibility before committing to the work.
How much residential alteration activity is recorded?
2,193 residential addition and alteration permits are reported for FY2024-25 in the city's September 29, 2025 Preliminary Official Statement, PDF page 70, printed A-29. The fiscal-year construction table reports activity as of June 30, 2025. City of Des Moines.
The city reports this as residential additions and alterations in a fiscal-year construction table. It is broader than waterproofing and may include unrelated work. The published aggregate does not establish the number of distinct wet-basement projects or available leads.
| Measure | Value / scope |
|---|---|
| Finding | 2,193 residential addition/alteration permits in FY2024-25 |
| Geography | City of Des Moines; residential additions and alterations |
| Data period / document | FY2024-25, reported September 2025 |
| Measure type | Administrative permit count |
Table 10: Administrative permit count. City of Des Moines; FY2024-25, reported September 2025. All residential additions/alterations; not a count of waterproofing jobs.
Methodology and limits
Download the source ledger · Read the calculation inputs.
This reference uses primary-publisher material checked on November 2, 2026. The Census entries are 2020-2024 ACS estimates; weather values are 1991-2020 station normals; local documents retain their own dates. Figures were matched to their source rows or document sections. Census QuickFacts was checked against its publisher page; NOAA and City of Des Moines source records were also retained for verification. The seasonal sum is calculated above. Ten headline findings are counted once each; repeated summaries, monthly input rows and program dates are supporting detail, not extra headline statistics. Rules and recommendations are labeled separately from measured activity.
Source mix: three Census findings, five NOAA findings and two City of Des Moines records. The original periods, geography and source links appear beside each number.
What remains unknown: these sources do not establish local average repair prices, the number of affected homes, available jobs, lead volume or a forecast of 2027 repairs. No property diagnosis or project eligibility is inferred.
Changelog: November 2, 2026: published the initial ten-finding reference with dated sources, the monthly table and a reproducible seasonal calculation. The source periods are preserved. Updates will identify changes to the source or explanation.
Frequently Asked Questions
Does this page measure how many basements need waterproofing?
No. The 90,105 household figure is a city housing estimate for 2020-2024, not a count of affected buildings. Climate normals, permit totals and guidance thresholds also have different denominators. A repair-demand claim would need an appropriate incident or project dataset. U.S. Census Bureau.
Are the weather figures observations from 2026?
No. The 1991-2020 normals describe the published climate baseline at DES MOINES INTL AP, IA US. The 36.55-inch annual precipitation value is not this year's rainfall. The 2026 page date records when we checked and compiled the sources. NOAA NCEI.
How was the seasonal total calculated?
We added six monthly normals, March through August, from the same NOAA station and 1991-2020 period. The result is 24.68 inches. The inputs and arithmetic appear above and in the downloadable ledger. This is our reproducible sum, not a count of flooding or repair incidents. NOAA NCEI.
Does the city automatically pay $1,500 for a sump-pump replacement?
No. The $1,500 amount is a conditional maximum for qualifying work. The city application excludes replacement of an existing pump. Obtain the current eligibility and preapproval decision before relying on reimbursement; the source documents do not confirm funds for an individual property. City application.
Sources
- U.S. Census Bureau; 2020-2024 ACS. Checked November 2, 2026.
- NOAA NCEI; 1991-2020 climate normals. Checked November 2, 2026.
- NOAA NCEI; 1991-2020 climate normals. Checked November 2, 2026.
- City of Des Moines; Ordinance 16,442, 2025; application revised 2025. Checked November 2, 2026.
- City of Des Moines; FY2024-25, reported September 2025. Checked November 2, 2026.
- City of Des Moines; application revised October 30, 2025. Checked November 2, 2026.
Definitions and project questions
hydrostatic pressure · drain tile · sump pump. These definitions explain the terminology. The glossary also links the other completed entries; a definition does not replace a property assessment.
Cite this resource
Suggested citation: Arthur Smelyansky. “Des Moines Basement Water Statistics 2026.” Lower Level Guide. Updated November 2, 2026. https://lowerlevelguide.com/des-moines-basement-water-statistics/
When citing a specific number, retain its original publisher, geography and data period. Link to this page and the original source when using a figure.